Simulating Electrodynamic Effects
Introduction
Very high frequency (around 100 MHz) capacitively coupled discharges have garnered a lot of interest in the plasma science community due to their ability to produce much higher plasma densities than conventional radio frequency (typically 13.56 MHz) discharges [1]. However, these high densities are paid for by the occurrence of electrodynamic effects[2], which lead to a radially non-uniform ion flux to the electrodes and processed surfaces. Two such effects are known:
- The standing wave effect. This effect is caused by the superposition of the electromagnetic waves travelling around the electrode from opposite edges. Since these waves cover different distances to each point of the electrode except the middle, the resulting path difference leads to declining amplitudes of the superposed axial electric fields from the middle of the electrode to the edges. This results in an ionization maximum in the middle of the discharges and, finally, in decreasing ion fluxes towards the edge of the electrode. If this effect occurs, depends on the relation of the plasma-shortened wavelength of the electromagnetic wave to the electrode dimensions; a wavelength much larger than the electrode radius results in small path differences and no significant effect on the uniformity of the discharge and the ion flux. Only if the wavelength approaches the electrode dimension, the path differences become large enough to be of importance. Note, that this also means, that the standing wave effect can also occur at lower frequencies if the electrode is large
enough. - The skin effect. This effect occurs at high plasma densities, which causes the skin depth of the plasma to be smaller than the reactor dimensions. In this case, the electromagnetic fields cannot perpetrate into the plasma bulk and have to travel around it. This leads to significant radial electric fields and enhanced ionization at the edge of the plasma bulk and, consequently, to higher ion fluxes at the edge of the electrodes.
Preventing these effects is of major interest to exploit the high densities of such discharges while maintaining a uniform particle flux to surfaces. Proposed methods include specially shaped electrodes[3], segmented electrodes [4], and dual-frequency discharges with carefully chosen frequencies [5]. Simulations provide valuable insights into the physical processes of high-frequency discharges and an easy way to test measures designed to prevent the occurrence of electrodynamic effects. This paper illustrates the ability of Quantemol-VT to simulate electrodynamic effects in capacitively coupled high-frequency discharges by comparing the results of a simulation of a 100 MHz discharge in argon in the electrostatic approach, which only solves the Poisson equation, with simulations solving the full set of Maxwell’s equations.
Setup of the simulation
Figure 1 shows a sketch of the simulated reactor. The powered electrode at the bottom is embedded into a generic dielectric material with a relative dielectric constant of 4 and an electric conductivity of 10-8 (Ωcm) -1 and covered with a silicon wafer. The counter electrode acts as a gas shower, which provides a gas flow of 200 sccm of argon. The sidewall is covered with another generic dielectric to prevent enhanced electric fields, especially in the corners, which can lead to unphysical ionization maxima.
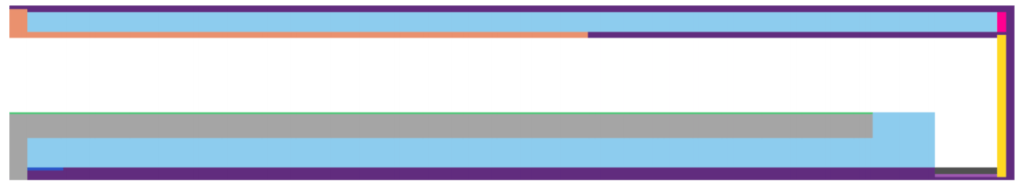
Figure 1: Sketch of the simulated reactor
Results
Figure 2 shows the ionization source function for both the electrostatic approximation and the fully electrodynamic simulation for different voltage amplitudes. In the electrostatic case, the source function shows no significant dependence on the radius, except for an ionization maximum at the electrode edge, caused by enhanced electric fields. The electrodynamic simulation, on the other hand, gives a clear radial dependence of the ionization on the radius with a maximum in the middle. The case with the highest amplitude of 200 V also shows an additional maximum at the electrode edge. This behaviour is mirrored in the electron density (fig. 3) and the ion fluxes to the wafer (fig. 4). The ion fluxes are completely flat across the electrode except for a maximum at the edge in the electrostatic case but decrease from the centre to the edge in the electrodynamic simulation. In the 200 V, the ion flux profile flattens at the edge due to the ionization maximum located there.

Figure 2: Ionization source function in the electrostatic approximation and fully electrodynamic simulation for different voltage amplitudes: 50 V, 100 V, 200 V from top to bottom


- The electric field is uniform in the electrostatic case but shows a radial dependence with a maximum in the centre in the electrodynamic simulation.
- The electrodynamic case also shows, that there is a radially dependent phase difference in the oscillation of the electric field. The slightly curved contour lines highlight this in comparison to the rather straight contour lines in the electrostatic case. In a way, we can see the electromagnetic wave travelling from the edge of the electrode to the centre.
- Both cases show enhanced electric fields at the electrode edge

The last point indicates, that the observed ionization maximum is indeed caused by edge effects, but the skin effect. Investigating the radial component of the electric fields reveals this to be the case. Figure 6 shows the radial component as a function of the electrode radius and time in the axial middle of the discharge. While we do see radial electric fields at
the edge of the plasma bulk in the electrodynamic case, their amplitudes are much too small to cause significant ionization. Furthermore, the electric fields also occur in the electrostatic approximation with the same amplitude, so they are certainly not caused by the electrodynamic skin effect.

Conclusion
We have demonstrated Quantemol-VT’s ability to simulate the standing wave effect in capacitively coupled very high-frequency discharges, resulting in ion fluxes to surfaces which decrease from the centre to the edge of the discharge. This was achieved using only fluid equations instead of more time-consuming kinetic approaches such as an electron Monte Carlo Simulation (eMCS). For comparison, we carried out the simulation of one case (100 V amplitude) with the eMCS; figure 7 shows the resulting ion fluxes, which show the same behaviour: they are flat in the electrostatic case and decrease towards the edge in the electrodynamic one. Compared to the pure fluid model, the maximum on the edge in the electrostatic case is missing, since the enhanced electric fields at the edge influence the ionization profile much stronger in the fluid model due to the local nature of the electron energy balance equation. The skin effect could not be demonstrated since the necessary high plasma densities were not reached. The absence of this effect was demonstrated by an analysis of the time-dependent electric fields, which do not show significant radial components at the plasma edge.

References
- V Vahedi et al., Phys. Fluids B 5, 2719 (1993)
- M A Lieberman et al., Plasma Sources Sci. Technol. 11, 283 (2002)
- H Schmidt et al., J. Appl. Phys. 95, 4559 (2004)
- Y Yang et al., J. Phys. D: Appl. Phys. 43, 152001 (2010)
- E Schüngel et al., Appl. Phys. Lett. 106, 054108 (2015)
- Y Yang et al., Plasma Sources Sci. Technol. 19, 055011 (2010)